Home Assistant - Accessing Historical Statistics
One of my favorite integrations in Home Assistant is the integration with the solar installation.
By monitoring electricity production/consumption statistics, I can increase self-consumption by utilizing periods of high production.
Recently, I wanted to build a simple dashboard showing how much net energy (the difference between energy drawn and sent to the grid) I produced on a given day, week, and month.
My inverter provides 2 entities:
- the amount of energy sent to the grid on a given day
- the amount of energy drawn from the grid on a given day
While daily production wasn't a problem, it was enough to add 2 helpers of the "template" type
{{ float(states("sensor.inverter_solarman_daily_energy_sold")) + (-float(states("sensor.inverter_solarman_daily_energy_bought"))) }}However, the problem arose when I wanted to access data from the last X days.
Several solutions are floating around on the internet, but the simplest and most robust is the solution based on the SQL integration.
Home Assistant uses SQLite as its default database, located at /config/home-assistant_v2.db
Essentially, there are two interesting tables in the database: statistics and statistics_meta.
Let's prepare a query that will extract the maximum value for each day from a specified date range.
(In this case, we're looking for the maximum value because the sensors provided by the integration record the energy consumed/returned cumulatively).
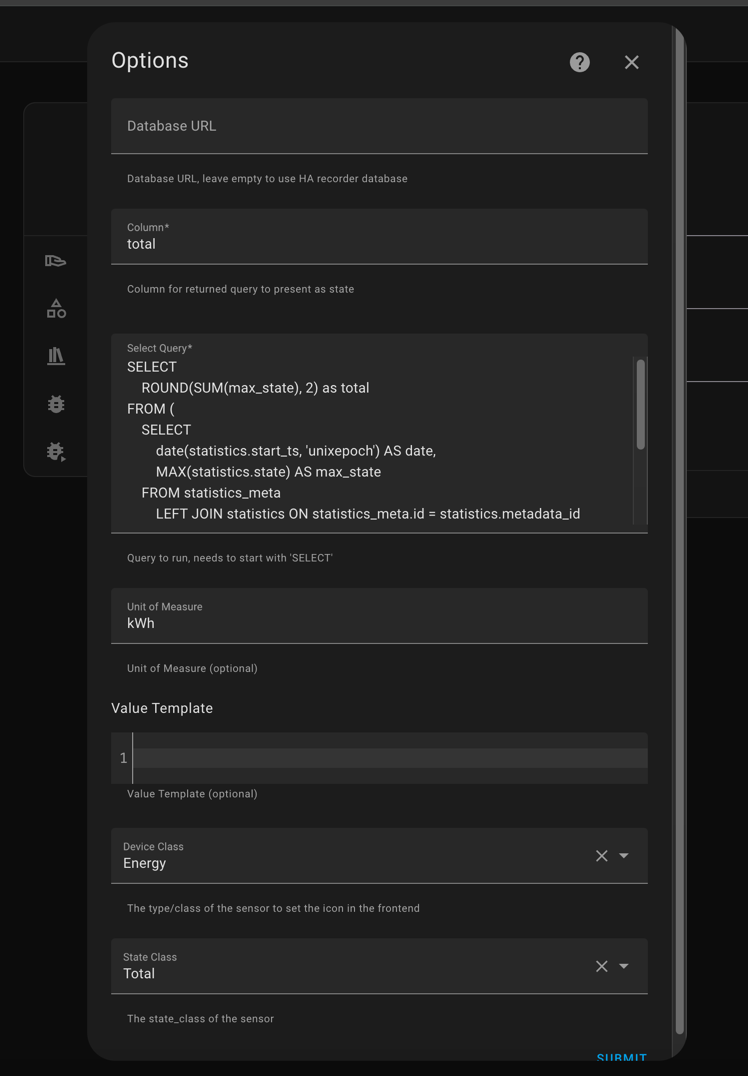
SELECT
    ROUND(SUM(max_state), 2) as total
FROM (
    SELECT
    date(statistics.start_ts, 'unixepoch') AS date,
    MAX(statistics.state) AS max_state
    FROM statistics_meta
    LEFT JOIN statistics ON statistics_meta.id = statistics.metadata_id
    WHERE statistics_meta.statistic_id = 'sensor.inverter_solarman_daily_energy_sold'
    GROUP BY date(statistics.start_ts, 'unixepoch')
    ORDER BY date DESC
    LIMIT 7
);
Then, all you need to do is search for "SQL" in the list of integrations and configure it accordingly.

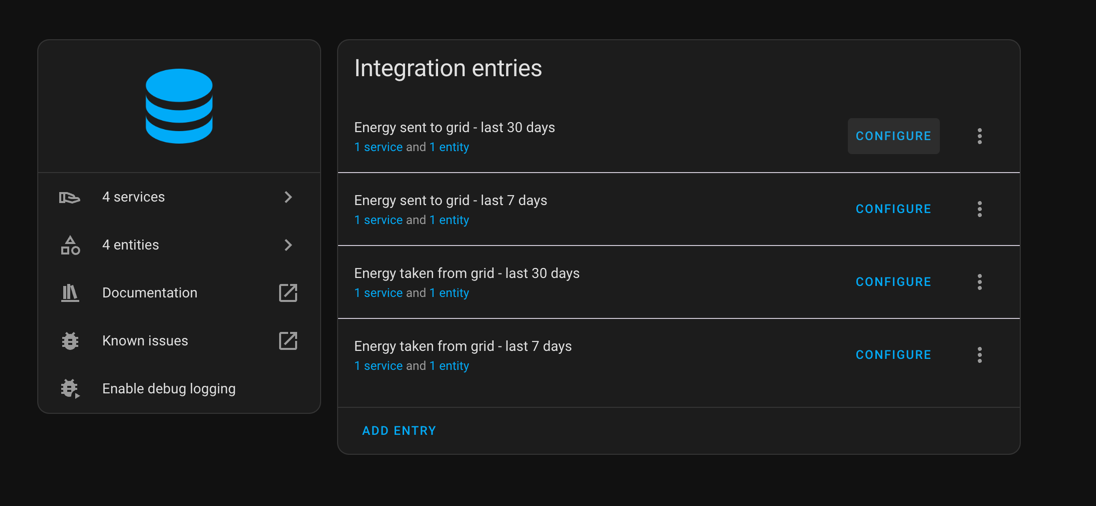
Repeat this process twice for energy returned/consumed, changing the number of days each time. In the end, the SQL integration should provide 4 entities as shown in the screenshot below.

Now all we have to do is create 2 helpers under "Settings -> Devices & services -> Helpers" for net energy from the last 7 and 30 days.
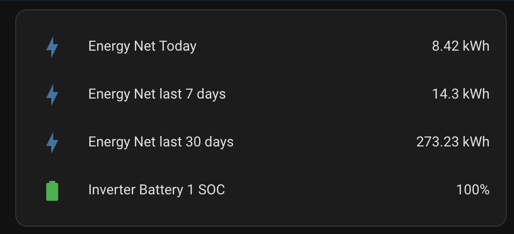
{{ float(states('sensor.energy_sent_to_grid_last_7_days')) + (-float(states('sensor.energy_taken_from_grid_last_7_days'))) }}{{ float(states('sensor.energy_sent_to_grid_last_30_days')) + (-float(states('sensor.energy_taken_from_grid_last_30_days'))) }}Done! From now on, we can use all 3 entities to display net energy from the last day/week/month on any chosen dashboard or in automations.
